2024 Long-Term Care Insurance Facts - Prices - Data - Statistics - 2024 Reports
The information and data provided below from the American Association for Long-Term Care Insurance is based on data researched or gathered by the organization. Information may be used with proper citation (Data from the American Association for Long-Term Care Insurance, www.aaltci.org) unless as indicated otherwise. Live links to this webpage are appreciated. Thank you.
We appreciate the financial support of insurance professionals who value AALTCI's role in creating heightened awareness and understanding of the value of LTCi. If you would like to join, click this link to become a supporting AALTCI member. Thank you.
Most Popular Searched Topics - 2024 Information
Click on the links to 'jump' to the specific data. Scroll DOWN for a complete listing.
Links to Prior Years Long-Term Care Insurance Information
Click on the links to 'jump' to that year's data.
2023 LTCi Price Index - Click Here To Access 2023 Long-Term Care Insurance Price Index
25 FACTS - 2022 - Click Here To Access 2022 Long-Term Care Insurance Data & Statistics
21 FACTS - 2021 - Click Here To Access 2021 Long-Term Care Insurance Data & Statistics
16 FACTS - 2020 - Click Here To Access 2020 Long-Term Care Insurance Data & Statistics
18 FACTS - 2019 - Click Here To Access 2019 Long-Term Care Insurance Data & Statistics
Click Here To Access 2017 / 2018 Long-Term Care Insurance Data & Statistics
2024 LONG-TERM CARE INSURANCE PRICE INDEX REPORTS
Click the links to jump down to the various PRICING REPORTS
LONG TERM CARE INSURANCE BUYERS - TRADITIONAL LTCi
Click the links to jump down to see the specific information.Click BACK TO TOP to return to the top of this webpage.
2024 LONG TERM CARE NEED DATA - NURSING HOME - HOME CARE
Click the links to jump down to see the specific information.Click BACK TO TOP to return to the top of this webpage.
2024 LONG TERM CARE INSURANCE DATA - STATISTICS - CLAIMANTS & MORE
Click the links to jump down to see the specific information.Click BACK TO TOP to return to the top of this webpage.
LOWEST & HIGHEST POLICY COSTS - 2024 LONG-TERM CARE INSURANCE
Here are actual prices from the TOP 3 SELLING LTC INSURANCE COMPANIES. Basically a comparison of virtually identical coverage
for a couple.
LTC Insurance Company 1: $5,018-per-year
Company 2: $6,247-per-year
Company 3: $6,321-per-year - YOU'D PAY 26% MORE
COUPLE both AGE 65 -- $165,000 initial pool growing at 3% compounded annually.
LTC Insurance Company 1: $7,137-per-year
Company 2: $7,844-per-year
Company 3: $8,493-per-year - YOU'D PAY 19% MORE
The ability to SAVE MONEY on LTC insurance is just one of many reasons we believe working with a long-term care insurance specialist is important.
Call the Association at 818-597-3227 with any questions. Thank you.
| Annual Premium - Purchase Age 55 | ||
|---|---|---|
| Single Male, Age 55 (Select Health) $165,000 level benefits | $ 950 | |
| Single Male, Age 55 (Select Health) benefits grow at 2% yearly | $ 1,750 | |
| Single Male, Age 55 (Select Health) benefits grow at 3% yearly | $ 2,075 | |
| Single Male, Age 55 (Select Health) benefits grow at 5% yearly | $ 3,690 | |
| Single Female, Age 55 (Select Health) $165,000 level benefits | $ 1,500 | |
| Single Female, Age 55 (Select Health) benefits grow at 2% yearly | $ 2,800 | |
| Single Female, Age 55 (Select Health) benefits grow at 3% yearly | $ 3,700 | |
| Single Female, Age 55 (Select Health) benefits grow at 5% yearly | $ 6,400 | |
| Couple Both Age 55 (Select Health) $165,000 level benefits | $ 2,080 combined | |
| Couple Both Age 55 (Select Health) benefits grow at 2% yearly | $ 3,875 combined | |
| Couple Both Age 55 (Select Health) benefits grow at 3% yearly | $ 5,025 combined | |
| Couple Both Age 55 (Select Health) benefits grow at 5% yearly | $ 8,575 combined | |
Rates above are for an initial pool of benefits equal to $165,000 (for EACH at age 55).
COMPOUND INFLATION BUILDS FUTURE POLICY VALUE:
Value of benefits when policyholder reaches AGE 85 equals $298,900 for EACH insured @2% -- $400,500 for EACH @ 3% -- $679,100 EACH INSURED @ 5%.
Prices for State of IL. Prices can vary by State. Calculated: Jan. 2024 and subject to change by the various insurers.
BACK TO TOP
Long-Term Care Insurance Policy Costs - 2024 - PURCHASE AGE 60
| Annual Premium - Purchase Age 60 | ||
|---|---|---|
| Single Male, Age 60 (Select Health) $165,000 level benefits | $ 1,200 | |
| Single Male, Age 60 (Select Health) benefits grow at 2% yearly | $ 2,060 | |
| Single Male, Age 60 (Select Health) benefits grow at 3% yearly | $ 2,585 | |
| Single Male, Age 60 (Select Health) benefits grow at 5% yearly | $ 3,800 | |
| Single Female, Age 60 (Select Health) $165,000 level benefits | $ 1,900 | |
| Single Female, Age 60 (Select Health) benefits grow at 2% yearly | $ 3,325 | |
| Single Female, Age 60 (Select Health) benefits grow at 3% yearly | $ 4,400 | |
| Single Female, Age 60 (Select Health) benefits grow at 5% yearly | $ 6,700 | |
| Couple Both Age 60 (Select Health) $165,000 level benefits | $ 2,600 combined | |
| Couple Both Age 60 (Select Health) benefits grow at 2% yearly | $ 4,500 combined | |
| Couple Both Age 60 (Select Health) benefits grow at 3% yearly | $ 5,800 combined | |
| Couple Both Age 60 (Select Health) benefits grow at 5% yearly | $ 8,700 combined | |
COMPOUND INFLATION GROWTH BUILDS FUTURE POLICY VALUE:
Value of benefits when EACH policyholder reaches AGE 85 equals $270,700 for EACH INSURED @2% -- $345,500 for EACH @ 3% -- and $588,750 for EACH @ 5%.
Prices for State of IL. Prices can vary by State. Calculated: Jan. 2024
BACK TO TOP
Long-Term Care Insurance Policy Costs - 2024 - PURCHASE AGE 65
| Annual Premium - Purchase Age 65 | ||
|---|---|---|
| Single Male, Age 65 (Select Health) $165,000 level benefits | $ 1,700 | |
| Single Male, Age 65 (Select Health) benefits grow at 2% yearly | $ 2,600 | |
| Single Male, Age 65 (Select Health) benefits grow at 3% yearly | $ 3,135 | |
| Single Male, Age 65 (Select Health) benefits grow at 5% yearly | $ 4,200 | |
| Single Female, Age 65 (Select Health) $165,000 level benefits | $ 2,700 | |
| Single Female, Age 65 (Select Health) benefits grow at 2% yearly | $ 4,230 | |
| Single Female, Age 65 (Select Health) benefits grow at 3% yearly | $ 5,265 | |
| Single Female, Age 65 (Select Health) benefits grow at 5% yearly | $ 7,225 | |
| Couple Both Age 65 (Select Health) $165,000 level benefits | $ 3,750 combined | |
| Couple Both Age 65 (Select Health) benefits grow at 2% yearly | $ 5,815 combined | |
| Couple Both Age 65 (Select Health) benefits grow at 3% yearly | $ 7,150 combined | |
| Couple Both Age 65 (Select Health) benefits grow at 5% yearly | $ 9,675 combined | |
COMPOUND INFLATION GROWTH BUILDS FUTURE POLICY VALUE:
Value of benefits when EACH policyholder reaches AGE 85 equals $245,000 for EACH INSURED @2% -- $298,500 for EACH @ 3% -- and $437,800 for EACH @ 5%.
Prices for State of IL. Prices can vary by State. Calculated: Jan. 2024
BACK TO TOP
Compare Traditional Long-Term Care Insurance to Linked Benefit
- NO Inflation Growth -
| Traditional Long-Term Care Insurance Policy - NO INFLATION GROWTH - YEARLY PREMIUMS | ||
|---|---|---|
| Single Male, Age 55 - Pool of LTC Benefits = $165,000 | $ 900 | |
| Single Female, Age 55 - Pool of LTC Benefits = $165,000 | $ 1,500 | |
| Linked-Benefit (Life Insurance + LTC) Policy - Company A - YEARLY PREMIUM PAYMENTS | ||
|---|---|---|
| Single Male, Age 55 - Pool of LTC Benefits = $180,000 / Min. death benefit = $120,000 | $ 3,540 | |
| Single Female, Age 55 - Pool of LTC Benefits = $180,000 / Min. death benefit = $120,000 | $ 3,265 | |
| Linked-Benefit (Life Insurance + LTC) Policy - Company B - ONE SINGLE PREMIUM PAYMENT | ||
|---|---|---|
| Single Male, Age 55 - Pool of LTC Benefits = $180,000 / Min. death benefit = $120,000 | $ 52,753 | |
| Single Female, Age 55 - Pool of LTC Benefits = $180,000 / Min. death benefit = $120,000 | $ 54,022 | |
Rates above include NO INFLATION GROWTH OPTION so benefit pool WILL NOT INCREASE. Prices can vary by State and subject to change by the various insurers. Calculated: Jan. 2024
Compare Traditional Long-Term Care Insurance to Linked Benefit
- WITH 3% Annual Inflation Growth -
| Traditional Long-Term Care Insurance Policy - With 3% Annual Growth - YEARLY PREMIUMS | ||
|---|---|---|
| Single Male, 55 - LTC Benefits @ Age 90 = $464,300 / no death benefit | $ 2,100 | |
| Single Female, 55 - LTC Benefits @ Age 90 = $464,300 / no death benefit | $ 3,600 | |
| Linked-Benefit (Life Insurance + LTC) Policy - Company A - YEARLY PREMIUM PAYMENTS | ||
|---|---|---|
| Single Male, 55 - LTC Benefits @ Age 90 = $521,850 / $181,000 growing death benefit | $ 5,025 | |
| Single Female, 55 - LTC Benefits @ Age 90 = $521,850 / $215,000 growing death benefit | $ 5,975 | |
| Linked-Benefit (Life Insurance + LTC) Policy - Company B - 1 SINGLE PREMIUM PAYMENT | ||
|---|---|---|
| Single Male, 55 - LTC Benefits @ Age 90 = $521,840 / Min. death benefit = $120,0000 | $ 71,700 | |
| Single Female, 55 - LTC Benefits @ Age 90 = $521,840 / Min. death benefit = $120,000 | $ 76,740 | |
BACK TO TOP
2024 Short-Term Care Insurance Price Index - With Home Care Only Pricing
| Short-Term Care Insurance - NURSING HOME (NH) AND HOME CARE BENEFITS | ||
|---|---|---|
| MALE, Age 65 - Nursing Home Benefit $200/day x 360 days + Home Care Benefit $1,050/week x 52 weeks | Monthly $125 | |
| FEMALE, Age 65 - Nursing Home Benefit $200/day x 360 days + Home Care Benefit $1,050/week x 52 weeks | Monthly $125 | |
| MALE, Age 75 - Nursing Home Benefit $200/day x 360 days + Home Care Benefit $1,050/week x 52 weeks ($54,600) | Monthly $277 | |
| FEMALE, Age 75 - Nursing Home Benefit $200/day x 360 days + Home Care Benefit $1,050/week x 52 weeks ($54,600) | Monthly $277 | |
| Short-Term Care Insurance - HOME CARE BENEFITS ONLY | ||
|---|---|---|
| MALE, Age 65 - Home Care Benefit of $1,050/week x 52 weeks ($54,600) | Monthly $63 | |
| FEMALE, Age 65 - Home Care Benefit of $1,050/week x 52 weeks ($54,600) | Monthly $63 | |
| MALE, Age 75 - Home Care Benefit of $1,050/week x 52 weeks ($54,600) | Monthly $133 | |
| FEMALE, Age 75 - Home Care Benefit of $1,050/week x 52 weeks ($54,600) | Monthly $133 | |
If you are a consumer with questions about short-term care insurance, we invite you to call the Association offices at 818-597-3227
BACK TO TOP
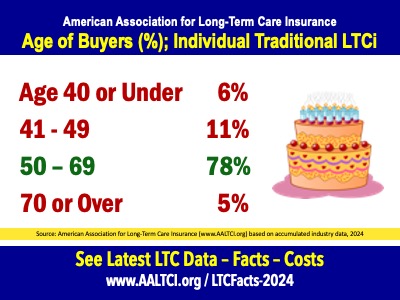
AGE OF BUYERS - INDIVIDUAL LTCi (New coverage)
The vast majority of buyers of individual LTC insurance are between ages 50 and 69. According to Jesse Slome, AALTCI director, the 'sweet spot' for applying for LTC insurance is between age 55 and 65.
When citing data, please credit: "American Association for Long-Term Care Insurance, 2024, www.aaltci.org"
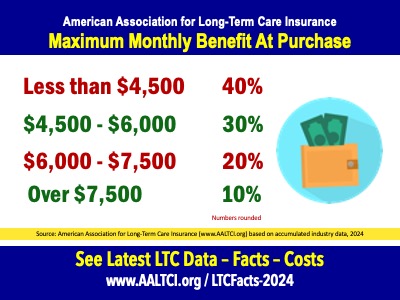
BACK TO TOPMONTHLY BENEFIT AMOUNT AT PURCHASE
The majority of buyers of individual LTC insurance select an INITIAL policy with a MAXIMUM MONTHLY BENEFIT of between $3,000 and $6,000. Adding an INFLATION GROWTH FACTOR will INCREASE the value of their benefit amount each year.
When citing data, please credit: "American Association for Long-Term Care Insurance, 2024, www.aaltci.org"
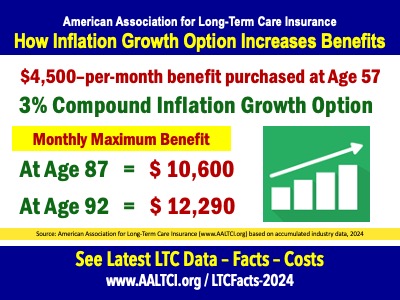
BACK TO TOPFUTURE INFLATION GROWTH PERCENTAGE AT PURCHASE
Currently, most people select some form of inflation growth so that their insurance benefits grow in value as they age. This chart shows the growth at 3% compounded annually. It is important to carefully get comparisons and understand the different ways insurers can calculate growth
When citing data, please credit: "American Association for Long-Term Care Insurance, 2024, www.aaltci.org"
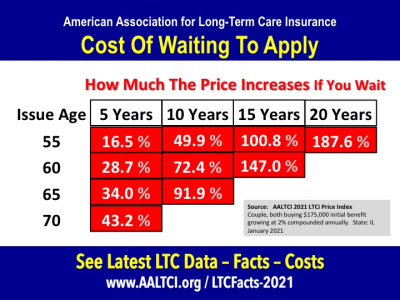
BACK TO TOPCOST OF WAITING TO APPLY FOR LONG-TERM CARE INSURANCE
Note: This comes from AALTCI's 2021 data. -- A comparison of equal coverage. If you wait (say from age 55 to 65) same initial coverage costs 49.9% more. NOT ONLY WILL YOU PAY MORE but you forfeit the increase in potential available benefits (thanks to having an annual growth factor. Plus YOU RISK BEING DECLINED for health reasons or paying more. Finally, YOU MAY LOSE THE COUPLE'S DISCOUNT due to spouse's death, divorce or denial of coverage.
When citing data, please credit: "American Association for Long-Term Care Insurance, 2021, www.aaltci.org"
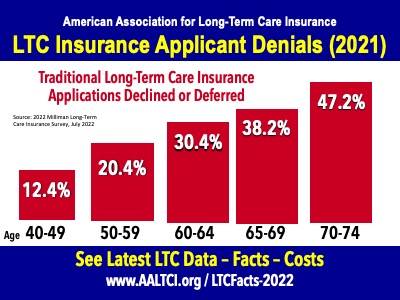
BACK TO TOPPERCENTAGE OF APPLICANTS DECLINED FOR LTC INSURANCE
Note: This comes from AALTCI's 2022 data. -- "Your money pays for long-term care insurance, but it's your health that really buys it. Insurers decline nearly half of those who apply after age 70," explains Jesse Slome, director of the American Association for Long-Term Care Insurance.
When citing data, please credit: "American Association for Long-Term Care Insurance, 2022, www.aaltci.org"
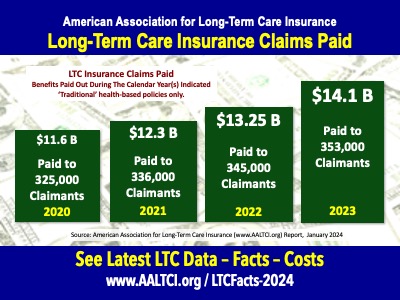
BACK TO TOPCLAIMS PAID 2023 (2020 - 2023)
Traditional long-term care insurers paid $14. Billion in claims in 2023. Access earlier reports via prior LTC Facts pages.
When citing data, please credit: "American Association for Long-Term Care Insurance, 2024, www.aaltci.org"
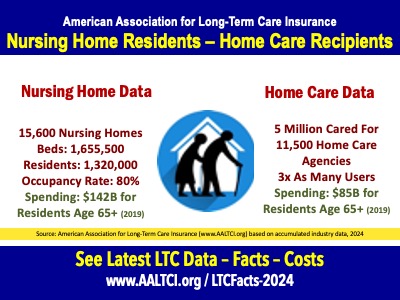
BACK TO TOPTOTAL NURSING HOME - HOME CARE NEED
There are just over 1.3 million people in U.S. nursing homes. Far more people need and receive care in their own home.
When citing data, please credit: "American Association for Long-Term Care Insurance, 2024, www.aaltci.org"
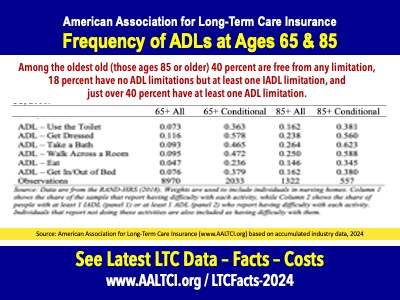
BACK TO TOPADL NEED AMONG SENIORS AGES 65 AND 85
The majority of those ages 65 or older have no limitations, while 9 percent (of the 2018 sample) has no ADL limitations but at least one IADL limitation, and 20 percent has a limitation with respect to at least one ADL. Among the oldest old (those ages 85 or older) 40 percent are free from any limitation, 18 percent have no ADL limitations but at least one IADL limitation, and just over 40 percent have at least one ADL limitation.
When citing data, please credit: "American Association for Long-Term Care Insurance, 2024, www.aaltci.org"
BACK TO TOPNURSING HOME STAYS AMONG SENIORS 65 AND 85
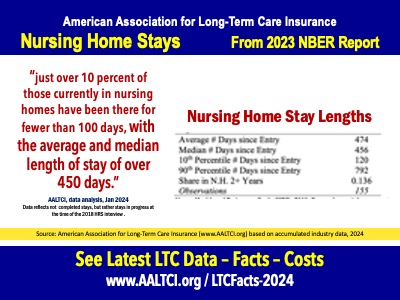
When citing data, please credit: "American Association for Long-Term Care Insurance, 2024, www.aaltci.org"
BACK TO TOPLENGTH OF HOME CARE NEED AMONG SENIORS 65 AND 85
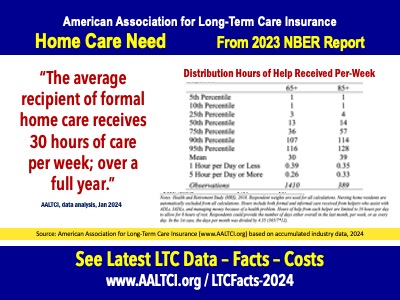
When citing data, please credit: "American Association for Long-Term Care Insurance, 2024, www.aaltci.org"
BACK TO TOPNEED FOR PAID LONG-TERM CARE SERVICES - WOMEN VERSUS MEN

When citing data, please credit: "American Association for Long-Term Care Insurance, 2024, www.aaltci.org"
BACK TO TOPNEED FOR PAID LONG-TERM CARE SERVICES - MARRIED VERSUS SINGLE PEOPLE

When citing data, please credit: "American Association for Long-Term Care Insurance, 2024, www.aaltci.org"
BACK TO TOPPROJECTED NEED FOR PAID LONG-TERM CARE SERVICES - MARRIED VERSUS SINGLE PEOPLE
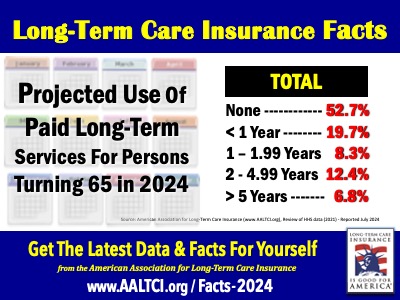
When citing data, please credit: "American Association for Long-Term Care Insurance, 2024, www.aaltci.org"
BACK TO TOPPROJECTED NEED FOR PAID LONG-TERM CARE SERVICES - WOMEN
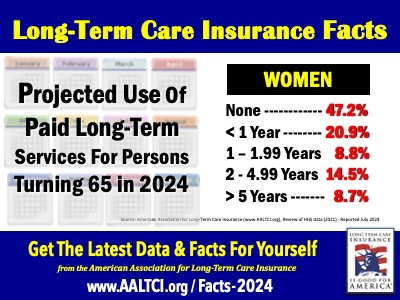
When citing data, please credit: "American Association for Long-Term Care Insurance, 2024, www.aaltci.org"
BACK TO TOPPROJECTED NEED FOR PAID LONG-TERM CARE SERVICES - MEN
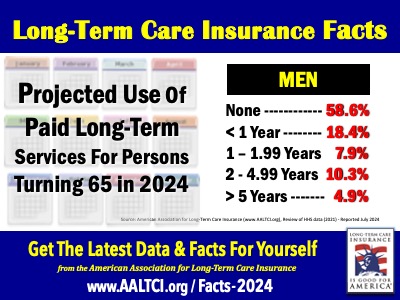
When citing data, please credit: "American Association for Long-Term Care Insurance, 2024, www.aaltci.org"
BACK TO TOPDISABILITIES AMONG MEDICARE BENEFICIARIES
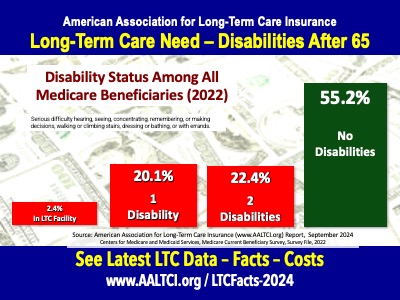
When citing data, please credit: "American Association for Long-Term Care Insurance, 2024, www.aaltci.org"
BACK TO TOPWhich Insurers Sell Traditional Long-Term Care Insurance (New coverage, 2024)
Mutual of Omaha
Thrivent
National Guardian Life
New York Life
Northwestern Mutual Life
Bankers Life
Thrivent for Lutherans
Policy costs can vary significantly as can benefit plan options between these carriers. It is vital (in the opinion of the Association) to connect with a specialist able to educate and compare.
List does NOT include companies offering linked-benefit LTC options.
LEADING LONG-TERM CARE INSURERS (Lives in Force - 2023 versus 2013)
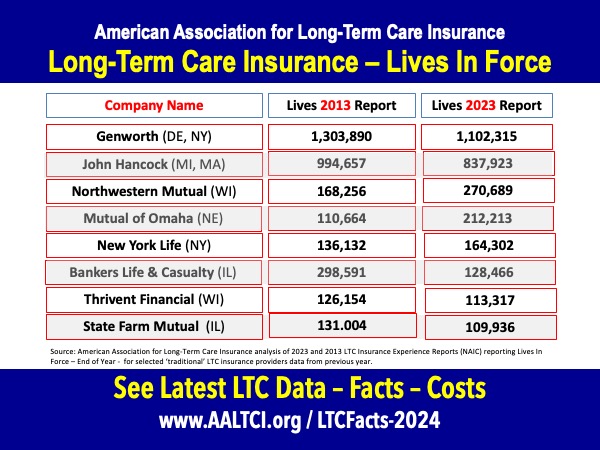
When citing data, please credit: "American Association for Long-Term Care Insurance, 2024, www.aaltci.org"
BACK TO TOPAGES WHEN LONG-TERM CARE INSURANCE CLAIMS BEGIN - Traditional & Linked Benefit LTC
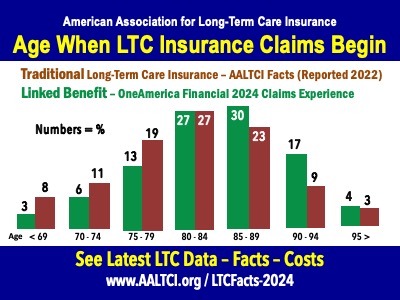
When using this graphic, please credit: "American Association for Long-Term Care Insurance, 2024, www.aaltci.org"
BACK TO TOPHOW LONG BETWEEN POLICY PURCHASE AND GOING ON LTC CLAIM?
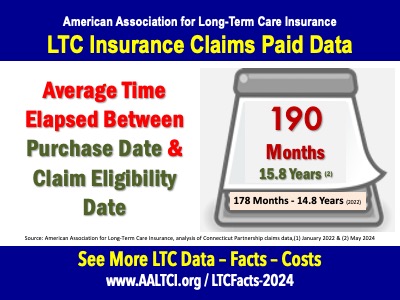
When using this graphic, please credit: "American Association for Long-Term Care Insurance, 2024, www.aaltci.org"
BACK TO TOP
REPORTERS - EDITORS & BLOGGERS

If you would like additional information please call or email Jesse Slome, Executive Director of the American Association for Long-Term Care Insurance.
Phone: 818-597-3227
Click Here To Email Jesse Slome